|
  
|
||
| Show/Hide Hidden Text |
|
|
||
| Show/Hide Hidden Text |
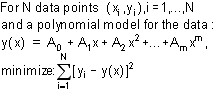
DPlot allows least-squares curve fitting to find the polynomial of a user-specified order that best fits the data. A least-squares curve fit is one in which the sum of the square of the errors between the actual data and the polynomial model are minimized:
It is easily possible to retrieve the curve fitting results from DPlot. Here is a step-by-step example:
Doc_num=FNDplot_doc_new(0) ! create new document |
Xmin=0 Xmax=2*PI Xpoints=200 Xstep=Xmax/Xpoints ! ALLOCATE REAL Datxy(1:Xpoints,1:2) ! 2-dimensional array ! RANDOMIZE Xi=BASE(Datxy,1) FOR X=Xmin TO Xmax STEP Xstep Y1=ATN(X/2)*(X/5+RND*(.1)+RND*.3-1) ! Datxy(Xi,1)=X Datxy(Xi,2)=Y1 IF Xi<Xpoints THEN Xi=Xi+1 NEXT X |
! transfer all data points to DPlot curve 1, line type 1 Dummy=FNDplot_xyz_data(Doc_num,Datxy(*),0,0,1,"y=atn(x/2)*(x/5+RND*(.1)+RND*.3-1)",1) |
Dummy=FNDplot_send_cmd("[SelectCurve(1)]") ! select curve 1 Dummy=FNDplot_send_cmd("[CurveFit(3)]") ! curve fitting, order=3 (->new curve 2) Dummy=FNDplot_send_cmd("[Color(1,0,255,0)]") ! curve 1 = blue Dummy=FNDplot_send_cmd("[Color(2,255,0,0)]") ! fitted curve 2 = red Dummy=FNDplot_send_cmd("[NumberFormat(0,8)]") ! number format for x axis = fractions of PI Dummy=FNDplot_send_cmd("[NumTicks(1,8)]") ! number of ticks for x axis Dummy=FNDplot_send_cmd("[ManualScale(,-1.2,,1.2)]") ! manual scale of y axis |
! show the diagram, 100% screen size CALL Dplot_show(Doc_num)
.. which should give the following result (curve 1 = blue, fitted curve 2 = red):
|
DIM Lastcurvefit$[1024],Crlf$[10] Crlf$=CHR$(10)&CHR$(13) Lastcurvefit$=FNDplot_request$("","LastCurveFit") IF Lastcurvefit$<>"" THEN IF Verb_=1 THEN OUTPUT CRT;" * Last curve fit results:"&Crlf$&Lastcurvefit$ END IF END IF
The variable Lastcurvefit$ now contains the following text: y = C(0) + C(1)*x + C(2)*x^2 + ... Coefficients C(00) = -0.0187877640693 C(01) = -0.370005452219 C(02) = 0.132414224948 C(03) = -0.00968681409756
Correlation coefficient is 0.94777033888 |
Dummy=FNDplot_doc_close(Doc_num) ! close the document |
|
